In this post, I try to help you manage data models with multiple fact and dimension tables. I share a few best practices that help me work in a structured way and make it easier for peers to understand the model. Data models can get messy quickly if you skip a few simple rules; your future self will thank you for keeping these practices in your workflow.
The data for this demo was created with AI purely for demonstration purposes and is available on my GitHub account along with the Power BI file: GitHub.
Can you immediately tell how these tables are related? I can't. So let's untangle the model together.
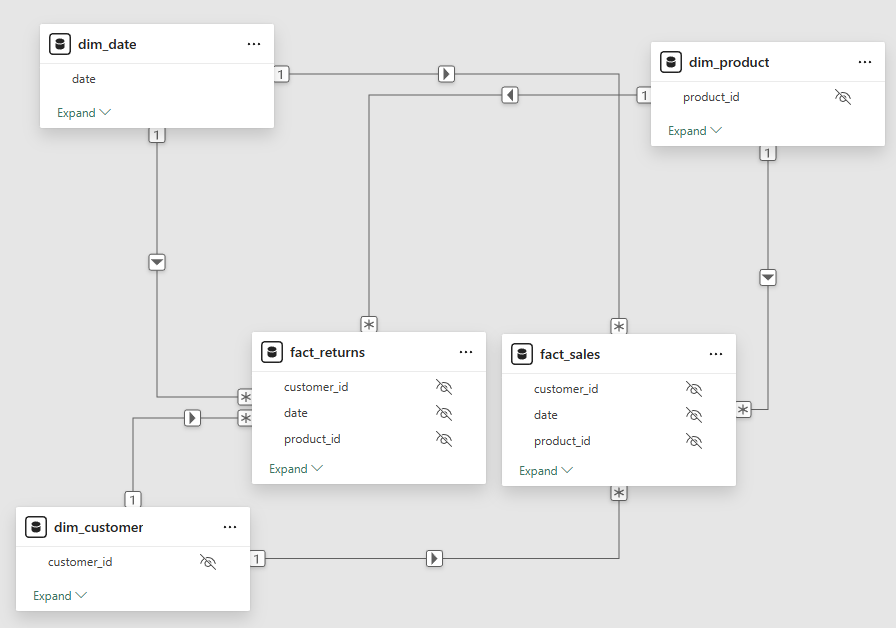
Figure: Data model with multiple fact and dimension tables
Model View
In Power BI's Model view, you can create views of your model. Go to Model view and click the + icon to create a new view. From the Data pane, drag in one of your fact tables (fact_sales in my case below). Now you have two options: if you already have relationships in place, right-click the table and select Add related tables; if not, drag in your dimension tables (such as dim_date and dim_customer) and add the relationships manually. You now have a model view of fact_sales. Do the same with fact_returns and you will have two clean views that are much easier to understand than the "main" view containing all fact and dimension tables.
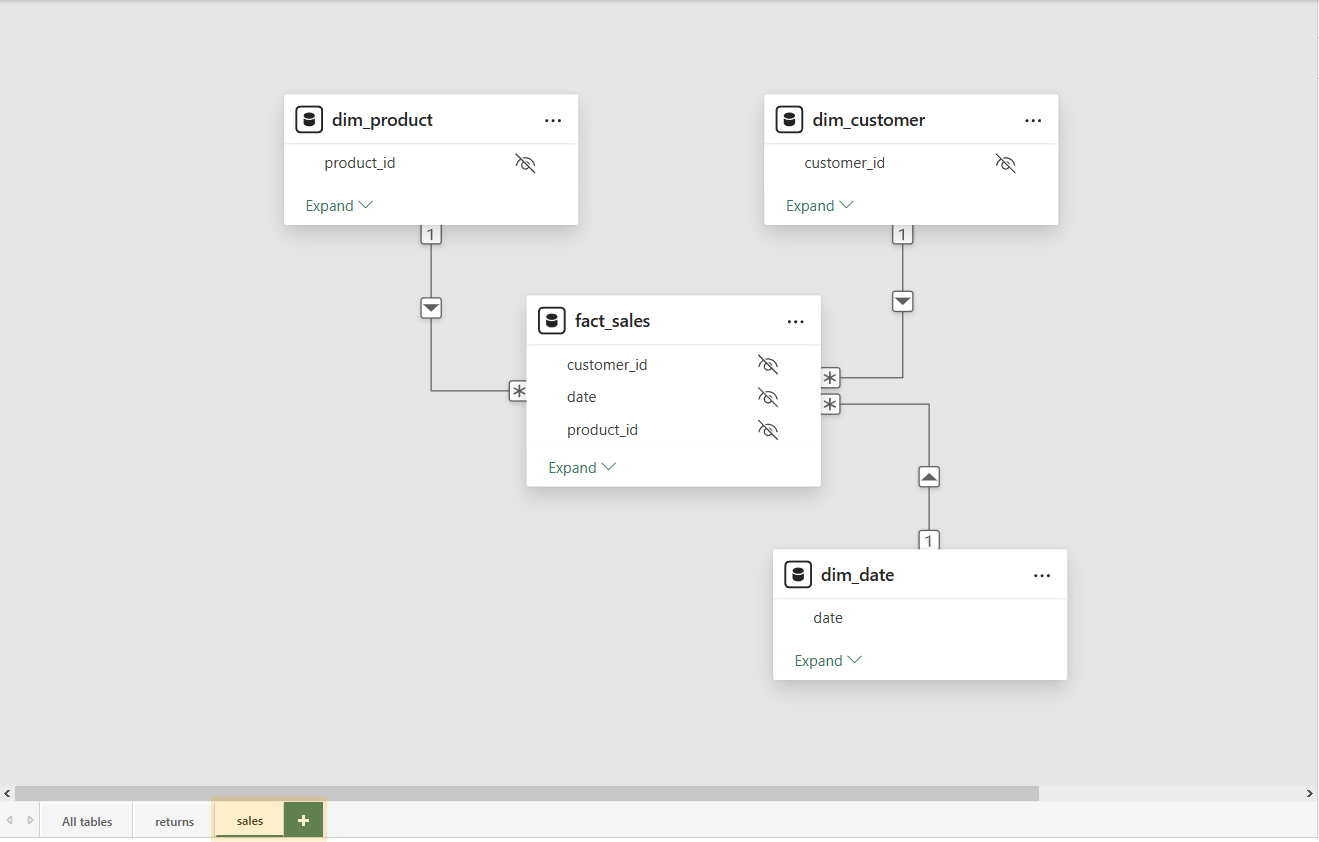
Figure: Model view of the fact_sales table
Quick tip: Hide ID columns that carry no business meaning. For example, hide the date key in the fact table and use the corresponding field from
dim_dateinstead.
Multiple fact tables vs. merged tables
In some cases, there is merit in merging multiple fact tables into one, simplifying the core data model structure. In my opinion, this only makes sense if both fact tables are (almost) identical. Brute-forcing them into one is often much more work than creating two views and relating each table to the dimensions without changing their structure.
Quick tip: If you want to merge tables, do it as early as possible in the data flow (in the ETL pipeline, in your data warehouse). Use Power Query as a fallback only if you can't edit the source.
Measures and multiple fact tables
In Blog #1, I showed one way to create a dedicated measure table. In my opinion, it's an extremely important step because it gives you a centralized place for all calculations.
With multiple fact tables, I recommend creating a subfolder structure within that measure table so you can separate measures for fact_sales and fact_returns (maybe _helper for independent helper measures). Navigate to the Model view again, select your measure, and set a Display Folder.
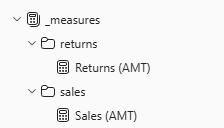
Figure: Measure table with subfolders
Since both fact tables are related to the same dimension tables, we can use measures for each table on the same dimensions (see the demo dashboard below showing Sales (AMT) and Return (AMT) per customer). The big win here is having one centralized place for all measures (separated by folders) and shared dimensions for all fact tables. By using separate views, we can more easily see their relationships, which makes it much easier to untangle a complex model. Below you can find a small sample table matrix and a slicer from a shared dimension; notice that any filter you apply recalculates both fact tables.
Power BI Embed
The demo data is available on my GitHub account: GitHub. If you want to play around with the file, download the data, open the Power Query Editor, and change the file_path parameter to the folder where you stored the data.
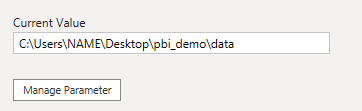
Figure: file_path parameter